

Numbers without context are just noise. A team closing 50 bugs a week sounds productive until you realise 30 of them were reopened the following sprint. That is where bug tracking metrics earn their place. They turn raw defect data into a signal that tells you whether quality is actually improving or just appearing to. A good bug report template gets you structured data to work with. A solid bug tracking tool gives you somewhere to measure it. The metrics are what tell you what the data actually means.
Why Bug Tracking Metrics Matter?
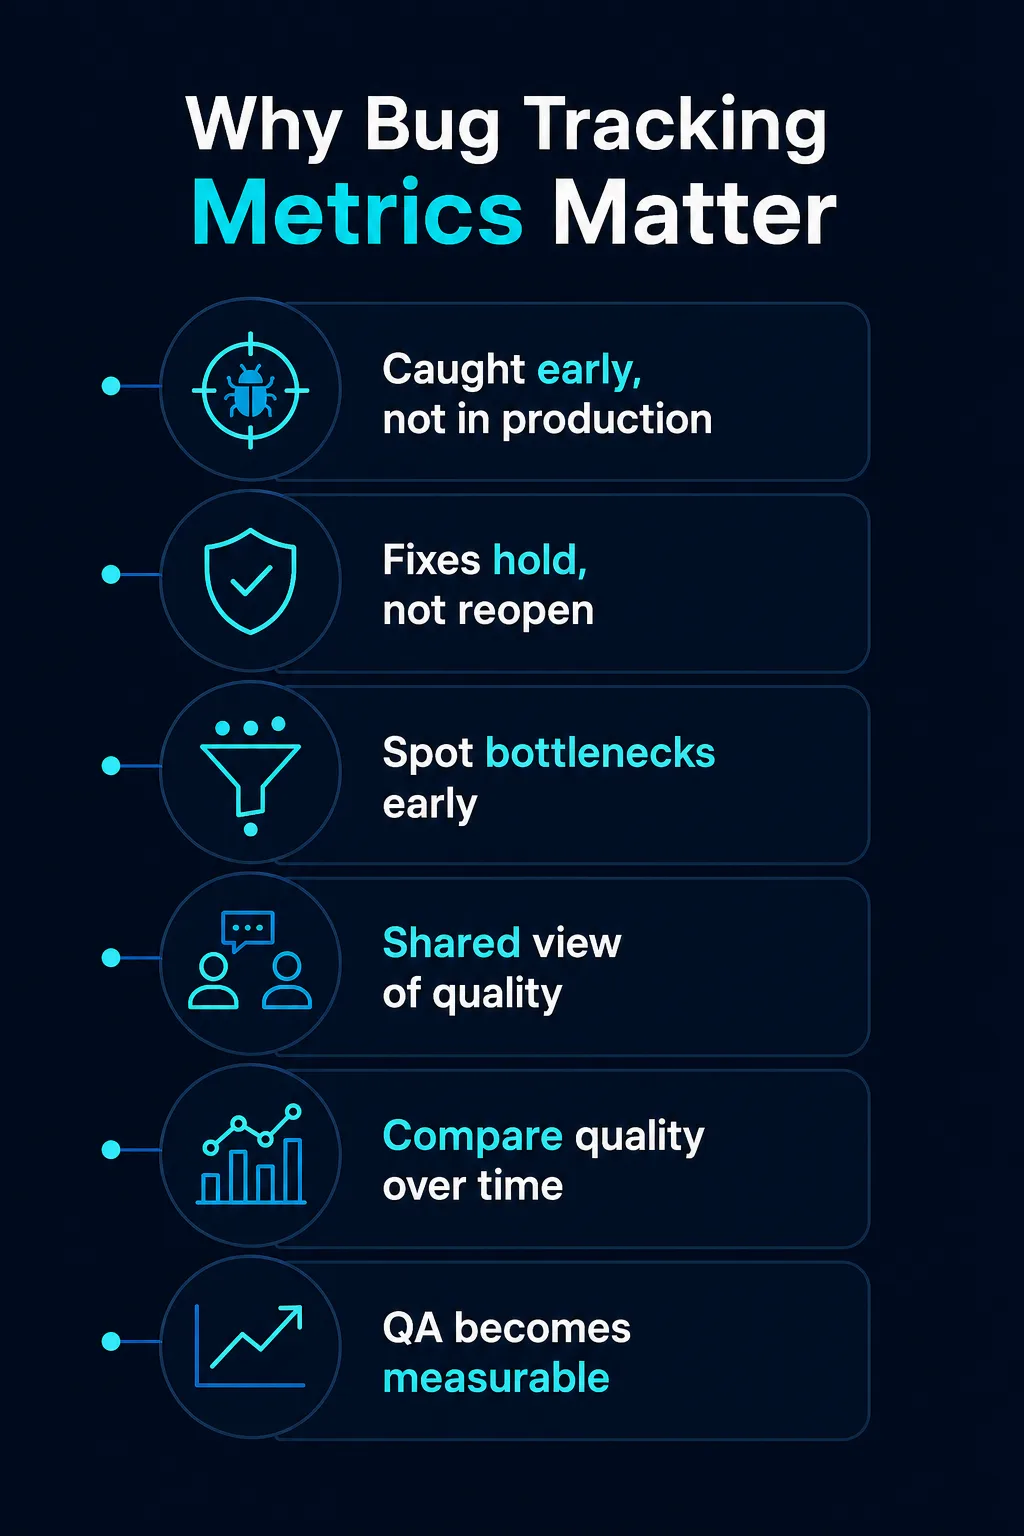
Most QA teams track bugs. Fewer teams track whether their bug management process is working. Issue tracking metrics close that gap.
- They reveal whether defects are being caught early or escaping to production
- They show whether fixes are holding or reopening repeatedly
- They surface bottlenecks in the resolution process before they become release blockers
- They give product and engineering teams a shared, objective view of quality
- They make it possible to compare quality across releases, teams, and time periods
- They turn QA from a reactive function into a measurable discipline
Without metrics, quality is a feeling. With them, it is a number you can act on.
What Makes a Bug Metric Worth Tracking?
Not every defect tracking metric deserves attention. The useful ones share a few characteristics.
- They are tied to something that actually affects users or the release cycle
- They can be measured consistently across sprints and releases
- They point toward a specific action when they move in the wrong direction
- They reflect real quality signals rather than team activity or volume
- They can be compared over time to show improvement or regression
- They are simple enough that the whole team understands what they mean
A metric that nobody acts on is just overhead. The ones worth tracking are the ones that change decisions.
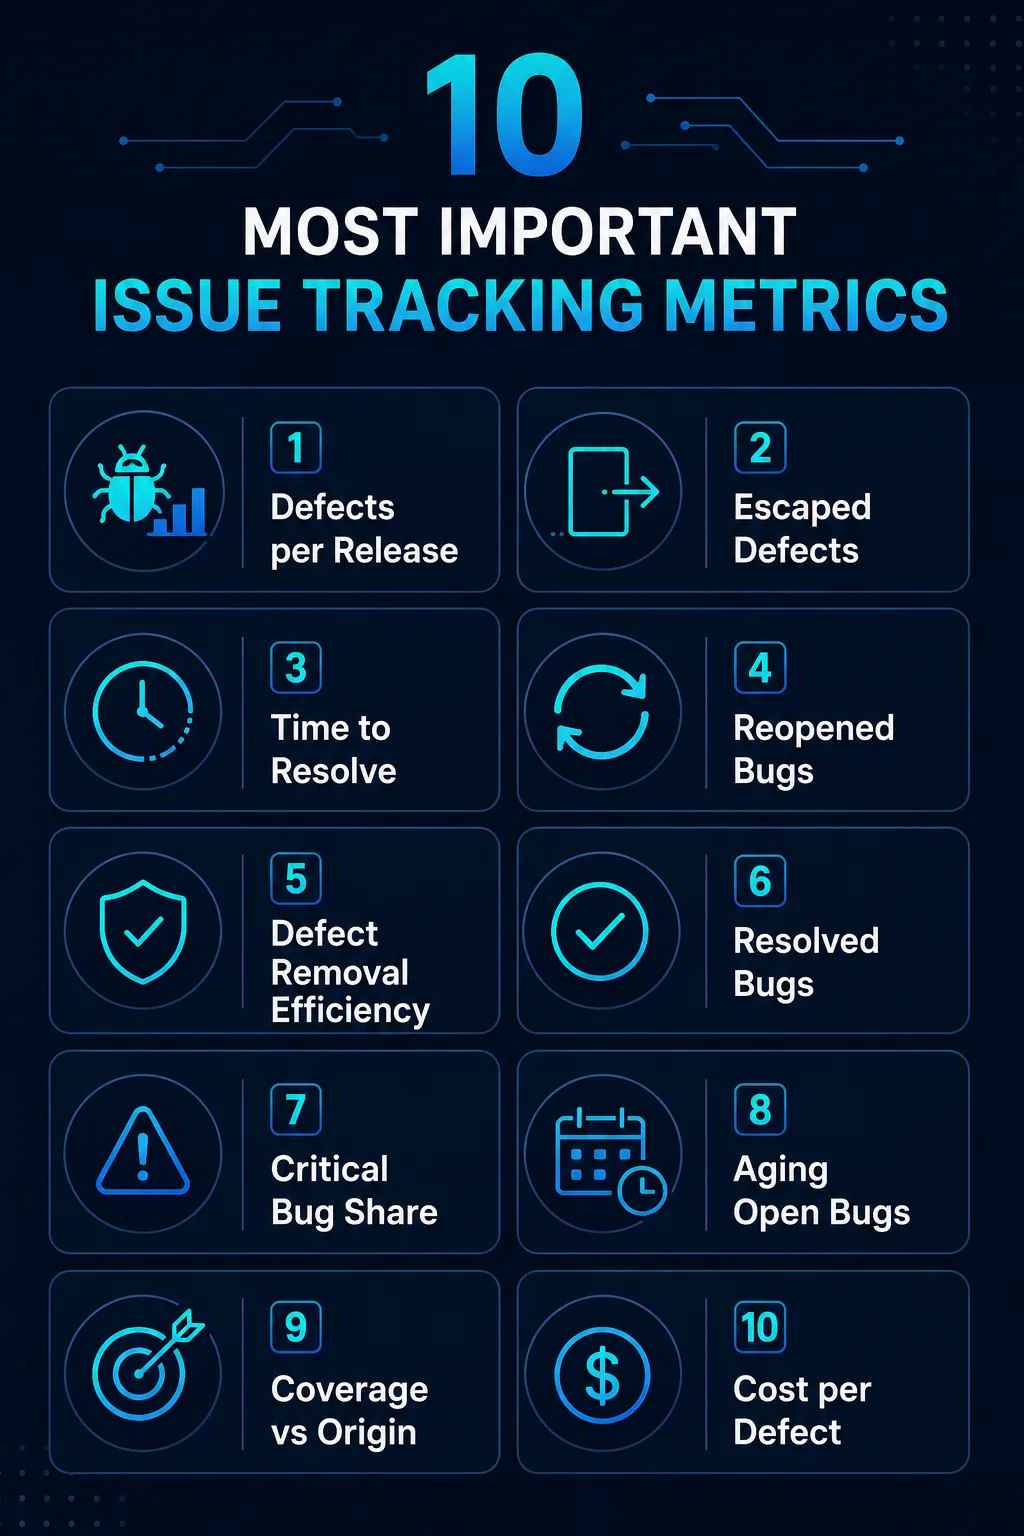
10 Most Important Issue Tracking Metrics
These are the bug tracking KPIs that consistently provide the clearest signal on product quality and process health.
- Defect density: The number of defects found per unit of code, usually per thousand lines or per feature. High defect density in a specific module is a reliable indicator of where quality work needs to focus. It separates problem areas from stable ones.
- Defect escape rate: The percentage of bugs that make it to production despite passing through QA. This is the most direct measure of how well your testing process is working. A rising escape rate means something in the process is failing.
- Mean Time to Resolution (MTTR): How long it takes from the moment a bug is logged to the moment it is resolved. Long resolution times point to bottlenecks in the workflow, unclear ownership, or bugs that are not being prioritised correctly.
- Bug reopen rate: The percentage of bugs marked as fixed that get reopened because the fix was incomplete or introduced a new error. A high reopen rate signals problems with how fixes are being verified, not just how bugs are being found.
- Defect removal efficiency: The percentage of total defects found before release versus after. Higher pre-release detection means testing is working. A low rate means defects are getting through. This metric is one of the clearest measures of testing effectiveness over time.
- Bug resolution rate: The number of bugs resolved in a given period compared to the number reported. When the resolution rate consistently falls behind the report rate, the backlog grows and release confidence drops.
- Critical bug ratio: The proportion of total bugs classified as critical or high severity. A rising critical bug ratio during development is an early warning sign that something more systemic is wrong with a feature or module.
- Age of open bugs: How long bugs have been sitting unresolved. Old bugs that nobody is working on accumulate technical debt and create risk. Tracking bug age keeps stale issues visible rather than buried.
- Test coverage vs defect origin: Where bugs are actually being found relative to where tests are focused. If a disproportionate number of defects keep surfacing in untested areas, the coverage strategy needs to change.
- Cost per defect: The estimated cost of fixing a bug at different stages of development. Defects fixed during development cost significantly less than those found in production. Tracking this metric builds the business case for investing in earlier, more thorough testing.
Common Pitfalls When Tracking Bug Metrics:
Metrics can mislead as easily as they inform. These are the mistakes that consistently distort the picture.
- Tracking volume over quality: A team closing a high number of bugs is not necessarily performing well. If the bugs are minor and critical ones are being deferred, volume is hiding the real story.
- Ignoring context: A spike in defect density after a major refactor is different from a spike in a stable module. Numbers without context produce wrong conclusions.
- Setting targets that encourage gaming: When teams are measured on bug closure rate, there is pressure to close tickets quickly rather than thoroughly. The reopen rate climbs, and nothing actually improves.
- Only measuring what is easy to measure: Bug count is easy. Defect escape rate requires more effort to calculate. Teams often track the former and ignore the latter, even though the latter matters more.
- Treating metrics as a report rather than a tool: Bug tracking KPIs are only useful if someone reviews them regularly and uses them to make decisions. A dashboard nobody looks at changes nothing.
- Comparing teams directly: Defect density in a legacy codebase undergoing active refactoring will look different from density in a greenfield project. Metrics need to be contextualised before they are used to evaluate team performance.
Conclusion:
Bug tracking metrics are all about understanding whether the software is getting better or worse, and whether the process of catching defects is working or letting things through. The ten metrics above cover the full picture: how many bugs exist, where they are coming from, how quickly they are being resolved, and how many are escaping to users. Start by picking three or four that reflect your team’s current biggest risk. Measure them consistently over several sprints. Let the trends guide decisions rather than individual data points. Quality does not improve because it is measured. It improves because measurement makes the right problems visible.