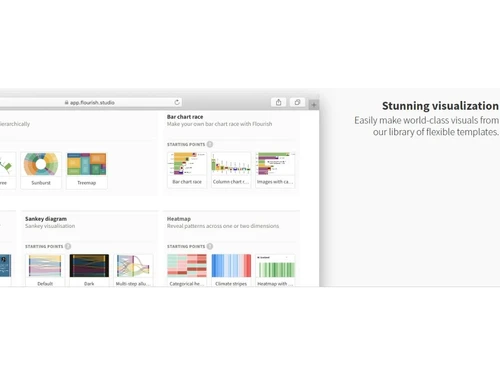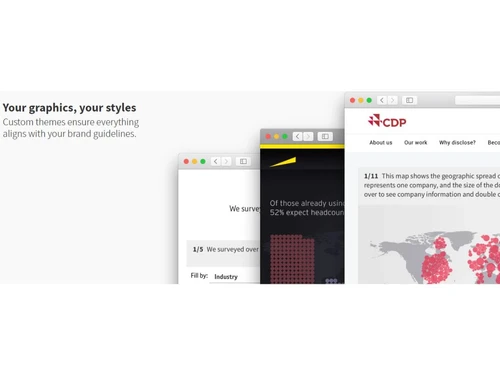


Flourish is a web-based platform designed for crafting engaging data visualizations and interactive narratives. With its intuitive interface, users can convert raw data into striking visuals such as charts, maps, and presentations without requiring coding knowledge. This versatility makes it suitable for applications in various fields, from journalism to business reporting. Users benefit from customizable themes, responsive graphics, and easy embedding options, ensuring that their visual content adapts seamlessly across devices.
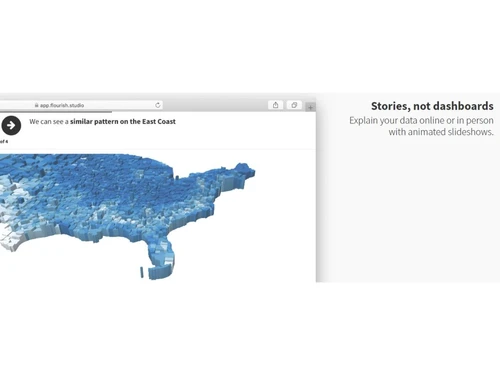
This platform emphasizes collaboration, enabling teams to work together efficiently on projects. Flourish’s features include animated slideshows and scroll stories, which facilitate dynamic storytelling through data. Users can upload data from live sources and spreadsheets via APIs, allowing for the creation of diverse interactive content, including quizzes and carousels. By simplifying the visualization process, Flourish supports both novices and experienced professionals, accelerating project timelines and enhancing effective communication of complex information. The pricing details are available upon request, with various options tailored to different needs and user counts.