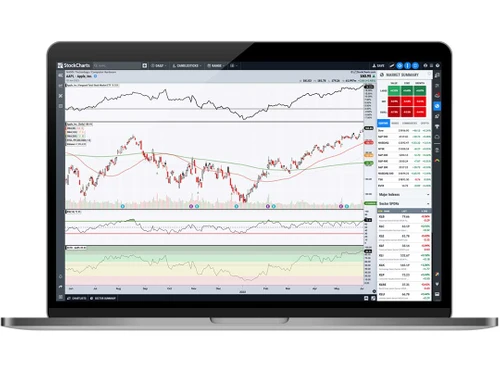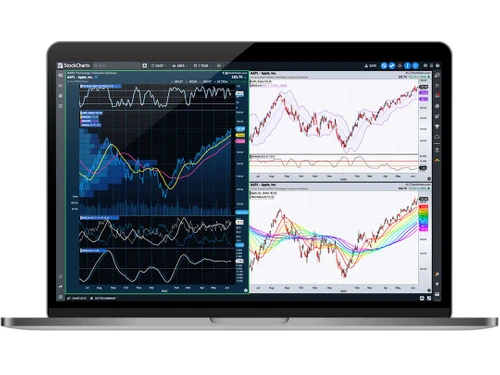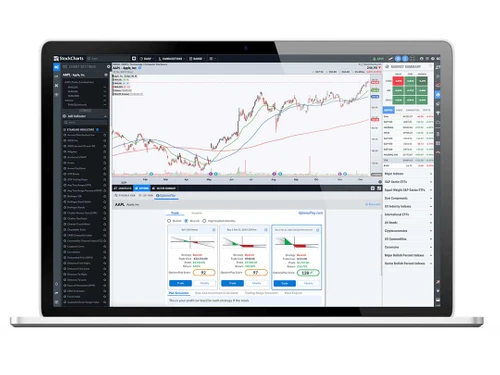


Designed for both novice and seasoned investors, StockCharts serves as a robust data visualization platform for monitoring stock market dynamics. It offers a variety of interactive chart types, including candlestick, line, and bar charts, which facilitate detailed analysis of stock performance. Users can leverage technical indicators such as moving averages, Bollinger Bands, and MACD to enhance their trading strategies. Features like customizable charting options, watchlists, and alerts empower users to monitor multiple stocks simultaneously and make informed investment decisions.
The platform accommodates a wide range of asset classes, from stocks and ETFs to commodities and cryptocurrencies, ensuring versatility for its users. Supportive resources, including educational materials and market commentary, further enrich the user experience. StockCharts provides both free and premium subscription options, with advanced tools available at various pricing tiers, starting at $20 in India through techjockey.com. Interested individuals can reach out to the product team for detailed inquiries regarding pricing and additional features.